DESIGN 240:
DESIGN WITH DATA
A Sequence of Primitives
"One of four Pacific adults (15 years or older) are current smokers", which is a statistic I found interesting inside the New Zealand context. Being a Pacific Islander, I wanted to try and fully convey this statistic through coding, in hopes to bring about realization of just how sadistic this is for not only the Pacific Island community in New Zealand, but also the future of the Polynesian community. I intend to create a GIF that can convey the harsh truth of smoking, and how it can affect people's lives and damage not only themselves, but people around them.
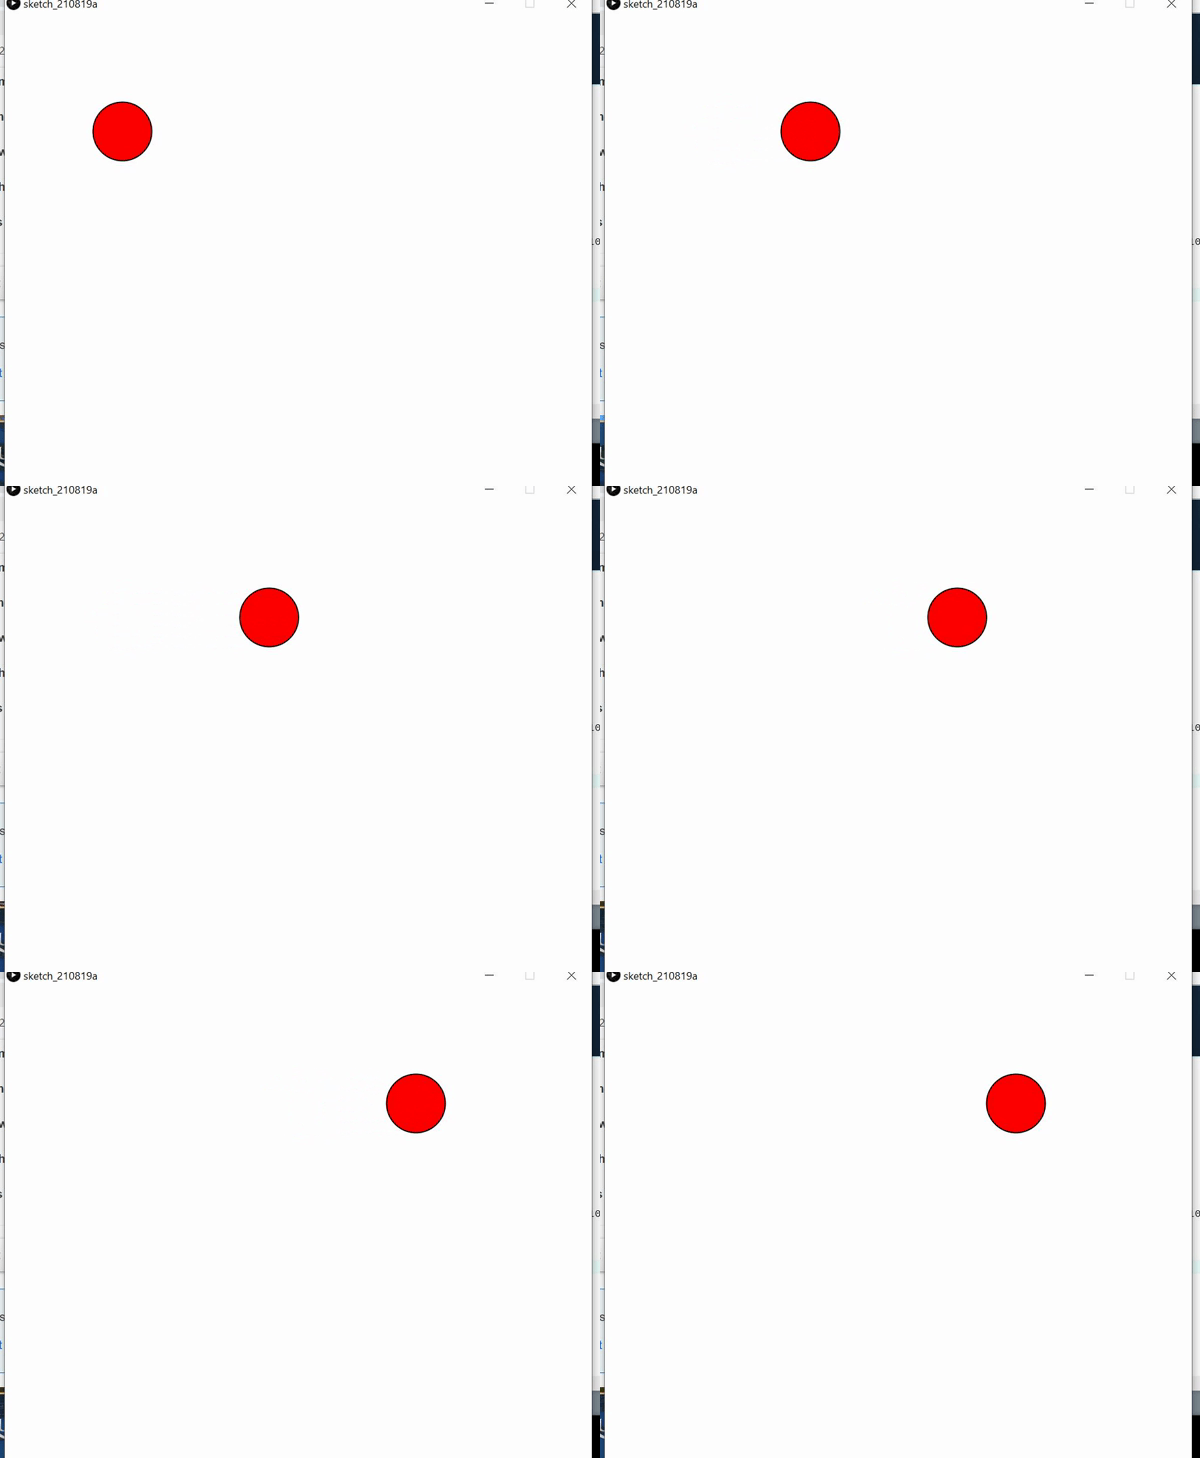
Through the coding software, Processing 3, I will try and convey the behavior of a smoker through static movement of shapes, to show the lack of stability that comes with smoking cigarettes.
Simple shapes will be heavily incorporated in my project, as well as utilizing of movements to fully differentiate one shape from the bunch - which is appropriate for the chosen SDG data stat.


First initial research commenced in the first two weeks, giving me the opportunity to reach out and seek potential Sustainable Development Goals to follow.
I ended up with three SDG(s), which I personally liked; Zero Hunger (SDG 2), Good Health and Well-being (SDG 3) and Quality Education (4).
I researched statistic data and information regarding the three chosen SDG(s), within the context of New Zealand and found some solid evidence of data.
Then, on the third week, I commenced iterations on potential sketches on how my code would look like. I chose to go with the stat of "1 in 4 Pacific adults (15 years and above) are current smokers".
I chose this stat due to how relevant it is to me, as a Pacific Islander, and how sadistic this information is - which I want to pursue more into a code, to try and convey.
I started sketching many iterations, as well as playing around with the Processing 3 software, to get insight on how my code would look like.
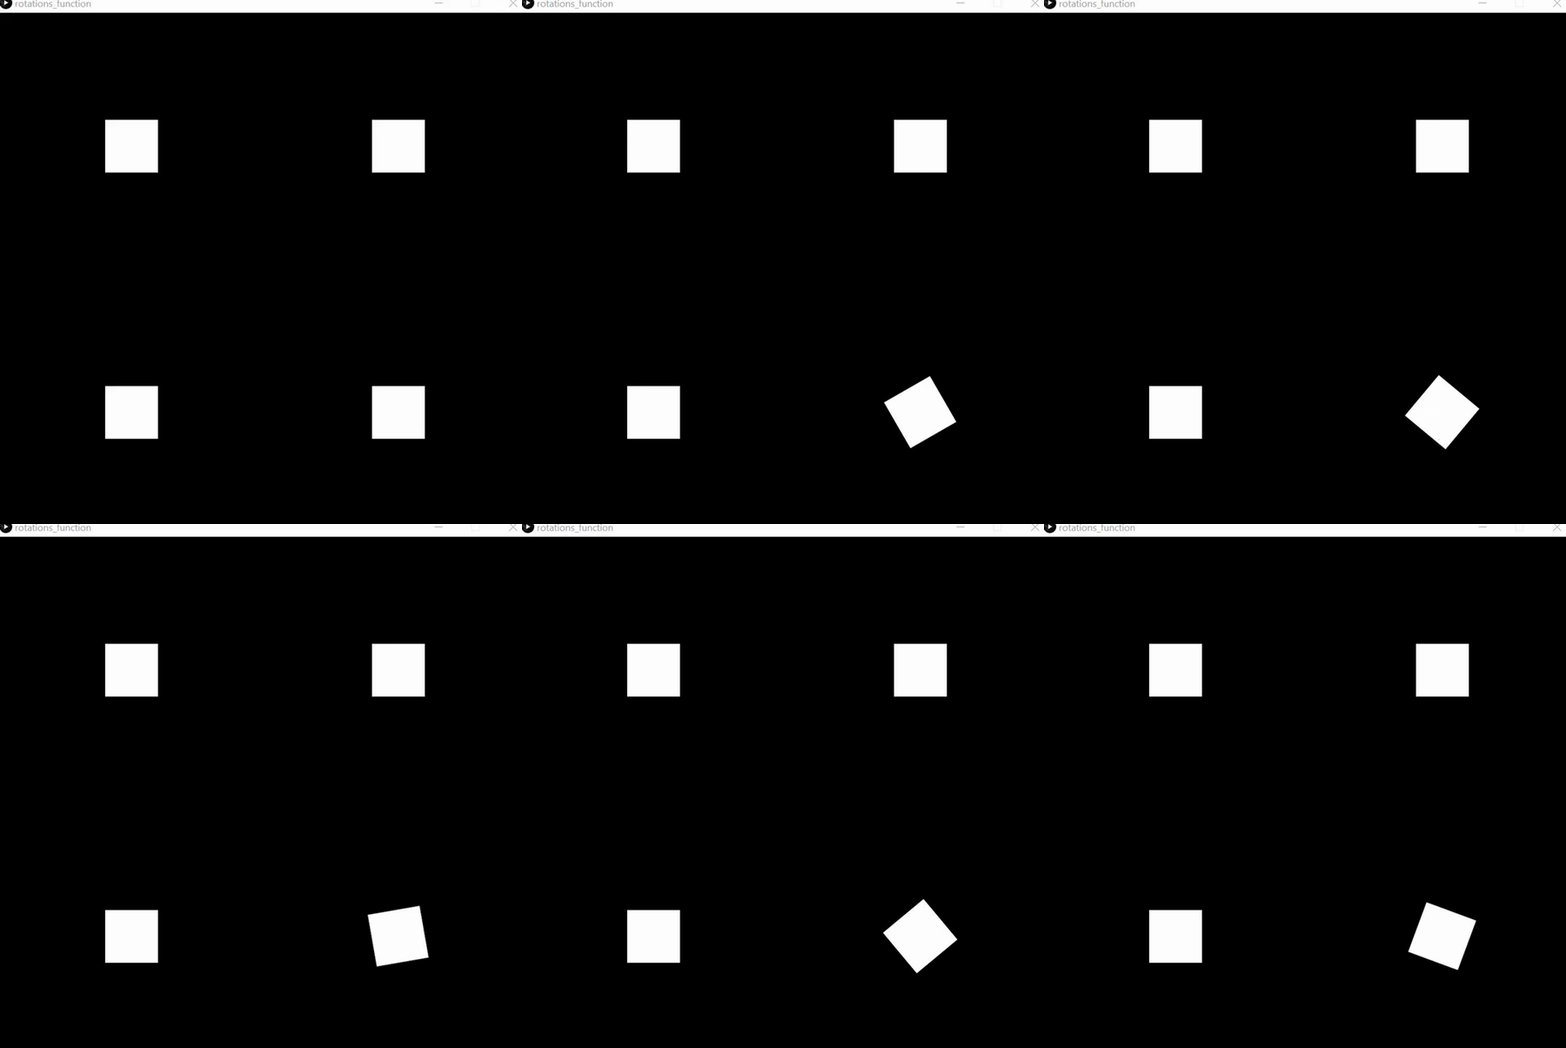
I incorporated much of the variables and random function to bring about a "shivering" look to one of my shapes - this brings about emotions to the shapes.


The many developments of my code was an amazing experience, and I only I had dedicated more of my spare time into further expanding my knowledge into the scripting, data coding with Java.
The final outcome; I create this simplistic lineal GIF, with four circles lined up next to one another, across the (0,500); with one circle on the end "shivering". This circle represents the "1" in the statistic, being the Pacific Islander adults that are current smokers.

int angle=0;
float circleX;
void setup() {
size(1000, 1000);
circleX = 800;
}
void draw() {
background(0);
rectMode(CENTER);
fill(255);
ellipse(100, 500, 100, 100);
ellipse(340, 500, 100, 100);
ellipse(590, 500, 100, 100);
pushMatrix();
fill(0);
stroke(255);
strokeWeight(20);
translate(circleX, 500);
ellipse(0, 0, 100, 100);
circleX = circleX + random(-3, 3);
popMatrix();
angle+=5;
}